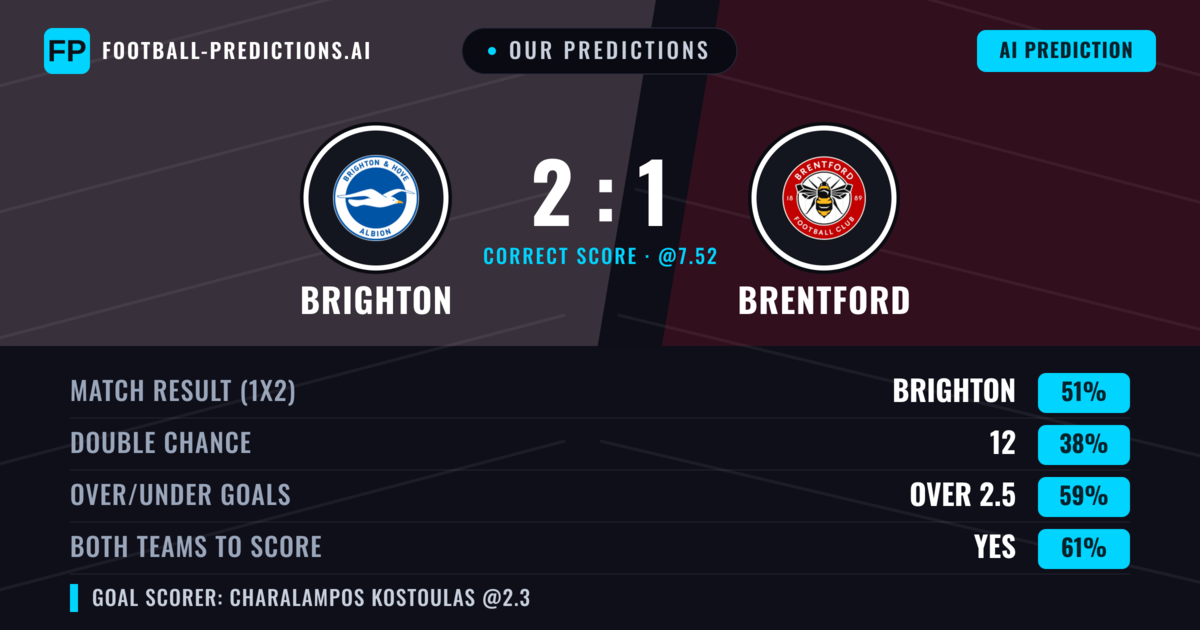



Amex Pressure: Brighton Seek Control Against a Defensively Stubborn Brentford
J. Hinshelwood could be the difference at the Amex Stadium. The Brighton striker enters this Premier League meeting with two goals and no assists in the attacking figures supplied, giving the home side one of the few clear individual reference points for a match that may otherwise be shaped by margins, discipline and resistance. Brentford’s answer may come through collective structure rather than one dominant individual, with M. Kayode, K. Lewis-Potter and V. Janelt each listed on one goal. Those numbers do not describe an explosive scoring race, but they do establish the attacking names most closely associated with Brentford’s output.
Sunday’s meeting at 14:00 GMT, London time, carries a sharper motivational edge than the numerical gap between third and sixth might initially suggest. Brighton are 3th in Premier League with 19 points from nine games and are explicitly identified as being in the title and Champions League race. Brentford are 6th in Premier League with 14 points from nine matches, without a specific table objective attached to their position. The difference is not that Brentford lack ambition; it is that every point here appears to have a clearer immediate meaning for Brighton.
That motivation should influence the atmosphere without overriding the evidence. Brighton’s supplied form is WLDWW, while Brentford’s is WDLDW. Both clubs have eight days of rest and have played one match in the last ten days, so neither side can claim a meaningful freshness advantage. The local audience can watch on NBC, and the most compelling pre-match question is whether Brighton can convert territorial and numerical superiority into a performance that breaks Brentford’s defensive resistance before the home crowd’s urgency gives way to anxiety.
Brighton’s High Ceiling Meets Brentford’s Compact Challenge
Brighton have built the stronger statistical case. Their comparison figures place them at 68% for form, 64% for attack and 88% for defence, producing an overall rating of 71%. Brentford’s corresponding numbers are 32%, 36%, 13% and 28%. Those percentages are not league-table data and should not be mistaken for expected-goal models, but they clearly portray a home team with greater momentum, greater attacking authority and a particularly substantial defensive edge.
The team-form sample reinforces that impression. Across the listed last-five-match data, Brighton have played 10 matches, won six, drawn two and lost two, with an average of 2.4 goals scored and 0.7 conceded per game. Their BTTS rate is 20%, while 70% of those matches featured a clean sheet. Brentford’s same sample contains 10 matches, three wins, six draws and one defeat, with averages of 1.7 goals scored and one conceded. Their BTTS rate is 70%, compared with clean sheets in 30%.
The contrast suggests two different routes to points. Brighton’s results are presented as a combination of scoring freely and preventing opponents from scoring, whereas Brentford’s profile points towards closer contests and more frequent exchanges between the teams’ attacks. A lower-scoring home victory would fit the broader Brighton profile. A draw, however, would not be entirely out of character for Brentford, whose six draws in the supplied form sample already represent their most common result.
There is also a scheduling distinction worth noting. Brighton’s 19-point position has been achieved in nine Premier League matches, despite the separate form sample covering 10 games with an average of 2.4 goals scored and 0.7 conceded. The information therefore comes from two differently scoped datasets and should not be combined into a fabricated points-per-game calculation. It is enough to say that the table places Brighton well above Brentford and that the broader form numbers point in the same direction.
The home side’s need to protect its position is reinforced by the gap in table context. Brighton have more riding on the result, and the supplied motivation assessment gives them a clear edge over a Brentford side whose specified aim is less narrowly defined. That does not guarantee three points, but it increases the likelihood that Brighton will seek control rather than simply manage the risk of defeat.
Attacking Options: Hinshelwood Leads a More Expansive Brighton Threat
Among the individual names provided, J. Hinshelwood carries the most obvious weight for Brighton. His two goals are the highest total attributed to any listed player, while M. De Cuyper has one. Hinshelwood’s significance is not based on a larger statistical catalogue; instead, it comes from the fact that he is the only supplied Brighton name with more than one goal. That makes him the natural focal point for the home side’s finishing.
Brighton’s team-level attacking average of 2.4 goals per game suggests that their production is not dependent on a single scorer, although only the names of Hinshelwood and De Cuyper are available here. It would therefore be unsafe to claim that Hinshelwood operates in a specific role, dominates a particular flank or is set to start in a named formation. The reliable conclusion is narrower: he has supplied more goals than any other Brighton player in the given player data, and the home side’s collective attacking strength gives him a platform from which to influence the match.
De Cuyper’s one goal adds another avenue of potential value. Brentford cannot focus exclusively on Hinshelwood without allowing Brighton’s wider contributors to determine the result. That is particularly relevant because Brighton’s clean-sheet rate of 70% means their preferred path to victory may involve controlling the opposition’s scoring opportunities rather than winning an open exchange. The objective is not simply to outscore Brentford; it is to make every attacking exchange carry greater value.
Brighton’s attack-versus-defence comparison also leaves room for confidence. At 64% for attack and 88% for defence, they are rated positively in both areas, whereas Brentford’s corresponding figures of 36% and 13% are much weaker. The available figures do not identify a formation, so the tactical expectation should be described in principles: Brighton are likely to seek greater control of territory and tempo, while Brentford need to remain compact, disrupt those patterns and make their own transitions count.
Brentford’s Collective Route to Trouble Brentford
Brentford’s statistics present a more complicated path to success. They have only one defeat in the supplied 10-match form sample, six draws and three wins. That is a record of resilience, even if the attacking numbers are less dominant. Their 1.7-goal scoring average is credible, but their one-goal conceding average and 30% clean-sheet rate suggest that controlling games at both ends is more difficult than simply remaining difficult to beat.
The individual figures for M. Kayode, K. Lewis-Potter and V. Janelt are evenly distributed at one goal apiece. None carries the concentration of output seen in Hinshelwood’s two, and no assists are listed for any of them. That absence matters tactically because it prevents a firm conclusion about who creates the most value for Brentford. A responsible preview cannot elevate one of the three into the role of chief creator without evidence.
What the distribution does suggest is that Brentford’s threat is not dependent on one unusually productive scorer in the supplied data. The three listed forwards or attacking contributors provide identifiable sources of goals, but the team’s higher BTTS rate indicates that many of their matches have involved both sides finding the net. Against Brighton, whose clean-sheet rate is 70%, Brentford would benefit from disrupting the home side’s defensive rhythm early and establishing that their own attempts can be converted.
The central difficulty for Brentford is the contrast between their draw-heavy form and Brighton’s greater attacking ceiling. A team with six draws in 10 can remain difficult to beat without controlling games. Brighton’s comparison score of 64% for attack implies a greater capacity to punish small openings, while Brentford’s 13% defensive rating suggests less scope for absorbing sustained pressure. Their best route is therefore likely to be disciplined rather than expansive: protect central space, delay the moment of Brighton’s breakthrough and force the home side to operate in a less settled rhythm.
Brentford also need to solve the issue of time. Brighton have a stronger title and Champions League motivation, while Brentford’s immediate table incentive is less specifically defined. In matches where one side is chasing acceleration and the other seeks stability, the side with greater urgency usually gains something from every early contest. Brentford cannot afford a slow start that turns the Amex crowd’s expectation into pressure on Brighton’s finishing.
No Formation Shortcut: Reading the Tactical Battle Without Guesswork
The supplied season-statistics section contains no confirmed formation for either club, and the listed season goals and clean-sheet fields are recorded as zero. Those empty fields are not usable evidence and should not be presented as meaningful performance statistics. As a result, there is no responsible basis for claiming that either side “usually” plays a specific shape or that a named player occupies a particular position.
The tactical preview must instead be built around the established team-level characteristics. Brighton’s 2.4-goal scoring average and 70% clean-sheet rate indicate a side capable of combining attacking output with defensive control. Their likely approach is to establish the game’s tempo, create pressure through collective movement and then protect any advantage without becoming excessively defensive. Because Hinshelwood leads the listed scorers with two goals, Brighton’s final-third actions may often move through him, but his exact starting role cannot be confirmed from the data.
Brentford’s six draws, one defeat and 70% BTTS rate in the form sample describe a side comfortable in tight contests but less secure when matches become fragmented. Their tactical priority would be to preserve the compactness that helps them avoid defeat, while using Kayode, Lewis-Potter or Janelt to provide enough attacking threat to discourage Brighton from committing too many bodies forward.
The most important tactical duel may be the first phase after a turnover. Brighton have the stronger overall and defensive comparison figures, so sustained Brentford possession could become dangerous if it breaks their structure. Conversely, if Brighton push too hard without protecting against transitions, the home side’s defensive statistics may be tested by an attack that has scored at an average of 1.7 goals in the listed sample.
Set pieces are another area where certainty must be avoided. No set-piece figures are provided, so neither club can be credited with superiority in that area. The available evidence points instead to a more general contest: Brighton trying to lower the frequency of Brentford’s attacks while increasing the quality of their own, and Brentford trying to turn a technically limited or attritional match into a decisive exchange.
Sixteen Years of Useful Background, Recent Results Split Three Ways
The head-to-head record supplies an important historical context without determining the present match. Across the last 17 meetings, Brighton have won seven, five have been drawn and Brentford have won five. The average total is 2.59 goals, while BTTS has occurred in 35%. Brighton therefore hold the historical edge in victories, but the draw and Brentford-win categories are substantial enough to prevent the record from indicating one-sided control.
The five most recent listed meetings offer no settled pattern. Brentford won 4-2 away in April 2025, Brighton responded with a 2-1 home win in November 2025 and then won 2-0 away in February 2026. Before those, Brighton won 2-1 at home in April 2024 and drew 0-0 at home in December 2024. Across this sequence, home and away records are mixed and both clean-sheet and high-scoring outcomes appear.
That variation is useful because it counters any simplistic conclusion that one team should expect either a comfortable home win or a low-scoring contest. The overall 35% BTTS rate is below the 61% forecast supplied for this match, while the 2.59-goal average sits above the over-2.5 forecast threshold. Historical data therefore creates tension rather than certainty: it suggests both scoring routes are possible, but neither should be treated as a foregone conclusion.
One further date detail should be handled carefully. The listed Brighton 2-1 Brentford meeting from November 22, 2025 is part of the head-to-head background, not the match being previewed here. The fixture under discussion takes place on November 8, 2026. More recent form should therefore carry more weight than old results, especially with current-season personnel and table context already reflected in the supplied data.
Market Reading: Where the Price Supports Brighton—and Where It Does Not
The available 1X2 market makes Brighton the favourite, with 1.91 on the home win, 3.75 on the draw and 3.50 on Brentford. The corresponding implied probabilities are 48.7%, 24.8% and 26.6%, which total marginally above 100% because of the bookmaker margin. After removing that margin in the simplest proportional way, the market’s effective central probabilities are approximately 48.7% for Brighton, 24.8% for the draw and 26.6% for Brentford.
Bet365’s local price reference is Brighton 1.85 / Draw 3.8 / Brentford 3.8. The important point is that the home side remains the favourite, but the shorter 1.85 price makes a Brighton win