


 Liga MX

 Scottish Premiership

 Superliga


 Primeira Liga

 HNL
HNL

 Liga I
 Ekstraklasa

 Czech Liga

 First League

 Super Lig
 MLS Predictions
 New York City FC
 New York Red Bulls
 San Jose Earthquakes
 Los Angeles FC
 CF Montreal
 Columbus Crew
 New England Revolution
 Orlando City SC
 DC United
 Charlotte
 US Open Cup Predictions
View all US Open Cup predictions 

 CONMEBOL Libertadores Predictions
 LDU de Quito
 Palmeiras
 Corinthians
 Estudiantes L.P.
 Flamengo
 Independiente del Valle
 UEFA Europa League Predictions
 Ararat-Armenia
 Sparta Praha
 Omonia Nicosia
 Celta Vigo
 AC Milan
 Benfica
 Anderlecht
 Lyon
Lyon Bayer Leverkusen
 Celje
Celje Premier League Predictions
 Brentford
 Chelsea
 Tottenham
 Aston Villa
 Brighton
 Arsenal
 Everton
 Ipswich
 Newcastle
 Hull City
 Serie A Predictions
 Monza
Monza Sassuolo
 Bologna
 Torino
 Udinese
 Cagliari
 AS Roma
 Inter
Inter Venezia
 Lazio
Lazio La Liga Predictions
 Atletico Madrid
 Osasuna
 Deportivo La Coruna
 Sevilla
 Barcelona
 Racing Santander
 Levante
 Athletic Club
 Real Betis
 Getafe
 Bundesliga Predictions
 Bayern München
 Union Berlin
 Eintracht Frankfurt
 SC Freiburg
 Hamburger SV
 1. FC Köln
 Werder Bremen
 FC Augsburg
 Borussia Mönchengladbach
 FSV Mainz 05
 Ligue 1 Predictions
 Monaco
 Lens
Lens Paris FC
 Strasbourg
 Angers
 Estac Troyes
 Le Mans
 LorientLyon
 Rennes
Past Predictions



Football Predictions & Betting Tips: Sep 14 – Sep 20, 2026
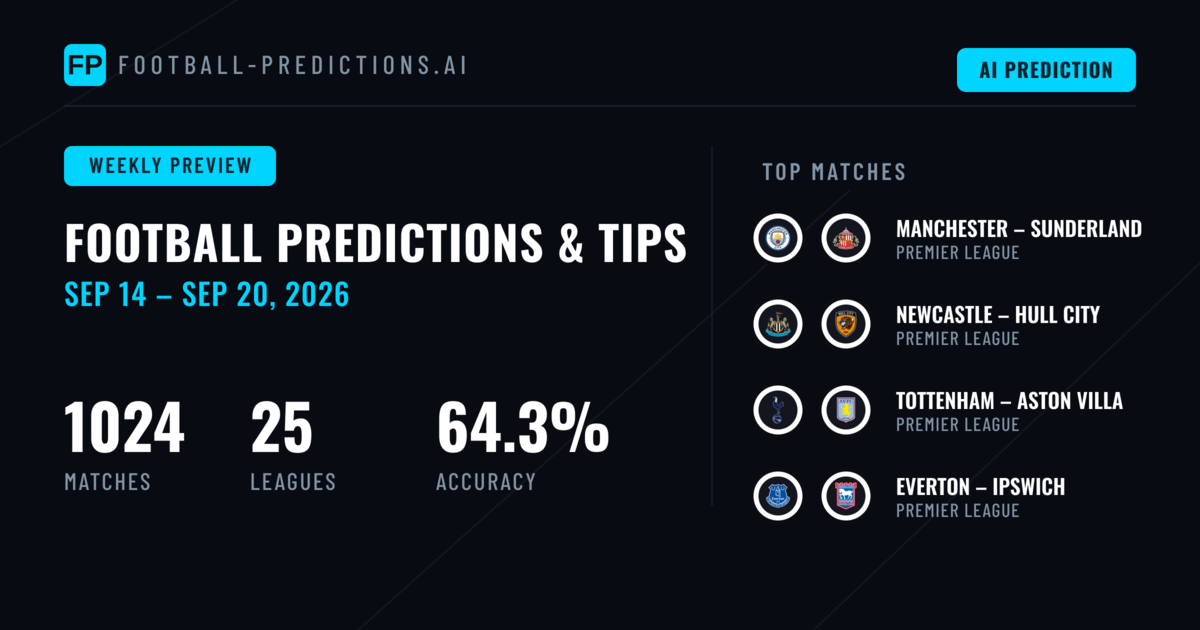
The Week Ahead: 1,024 Matches Set to Light Up Global Football
Football supporters across every continent face a feast of action this week as 1,024 matches populate the calendar from September 14 through September 20, 2026. The scope spans elite continental competitions, domestic cup action, and league fixtures across multiple countries, ensuring that armchair analysts and bettors alike will find no shortage of opportunities to assess form, fitness, and fixture congestion.
Among the standout competitions drawing attention this week, the UEFA Europa League continues its group stage with several teams looking to establish early command of their pools. South American club football's premier competition, the CONMEBOL Libertadores, also enters a crucial phase with several sides jostling for position in their respective groups. Domestically, English and Italian clubs turn their focus to cup matters, with the FA Cup and Coppa Italia producing early-round eliminators that offer smaller clubs the chance to test themselves against top-flight opposition.
With such a densely packed schedule, the week presents unique analytical challenges. Teams operating across multiple competitions must carefully manage squad rotation, while others may find themselves navigating congested fixture lists with minimal recovery time between outings. The geographical spread of matches means that analysis must account for varying conditions, travel demands, and the impact of recent international duty on player availability. These factors combine to create a landscape where unexpected results become not merely possible but statistically probable across the 1,024 encounters scheduled.
Midweek European and South American Showdowns Take Center Stage
The week ahead delivers a compelling mix of UEFA Europa League action and CONMEBOL Libertadores drama. From Mediterranean clashes to Balkan encounters and South American battles, these four fixtures pit teams in contrasting domestic situations against each other with plenty at stake in continental competition.
Hapoel Beer Sheva vs Dinamo Zagreb
 vs
vs 
A significant gap in current domestic form sets the tone for Wednesday's Europa League opener. Hapoel Beer Sheva vs Dinamo Zagreb sees the Croatian champions arrive in third place domestically while Hapoel sit third in their own league. The head-to-head record between these sides shows one draw and one away victory across two meetings, averaging 4.5 goals per encounter. Our model predicts a home win at 50% confidence, with both teams failing to score at 62% confidence. The high-scoring nature of their previous meetings suggests one goal may decide this contest.
Levski Sofia vs Red Bull Salzburg
 vs
vs 
Thursday brings a fascinating encounter as league leaders Levski Sofia welcome a Red Bull Salzburg side sitting third in their domestic standings. Levski Sofia vs Red Bull Salzburg presents a genuine tactical puzzle. Our model indicates a draw as the most likely outcome at 33% confidence, with under 2.5 goals backed at 57% and both teams to score evenly split at 50%. Salzburg's European pedigree gives them a slight edge on paper, but Levski's domestic dominance cannot be dismissed. Expect a tightly contested affair with few clear-cut chances.
Celtic vs Ferencvarosi TC
 vs
vs 
Celtic's domestic invincibility should carry them through Thursday's Europa League test against Ferencvarosi TC. Celtic vs Ferencvarosi TC sees the Scottish champions clear favorites with a home win predicted at 50% confidence. Ferencvarosi TC sit fifth in their league, creating a disparity in current form. The under 2.5 goals market carries the highest confidence of the week at 63%, while BTTS no receives 56% backing. Celtic have won two of their three previous meetings with Ferencvarosi, averaging 3.3 goals across those clashes. The Hungarian visitors must tighten their defensive shape significantly to avoid another setback.
Platense vs Fluminense
 vs
vs
Tuesday's Libertadores action delivers a battle between South American giants and domestic outsiders. Platense vs Fluminense features a side thirteenth in their league hosting the league leaders. Despite Fluminense's commanding domestic position, our model favors a draw at 33% confidence. The under 2.5 goals market receives 54% backing, while BTTS yes carries 60% confidence — the highest such figure across all four featured matches. This signals a contest where both defenses may bend but not completely break. Fluminense's superior quality should eventually tell, though Platense possess enough to trouble the Brazilian league leaders.

 AC Milan vs Benfica
Benfica travels to San Siro on Wednesday with the stronger league position, sitting second in the Portuguese top flight compared to AC Milan's fifth-place standing in Serie A. The data favors an away victory with 50% confidence, while the under 2.5 goals market shows stronger conviction at 60%. Neither side appears likely to score, with BTTS marked at 52% confidence against. Their sole previous meeting produced just one goal. A tight, low-scoring affair suits Benfica's current trajectory.

 Corinthians vs Estudiantes L.P.
Thursday's CONMEBOL Libertadores encounter sees Estudiantes L.P. backed to win despite sitting five places below Corinthians in their domestic league. The away side carries 45% prediction confidence into this fixture. Goals should be limited, with under 2.5 markets at 55%, though both teams finding the net remains the preferred outcome at 59%. The two-team head-to-head history shows one win each with an average of 1.0 goals per match.

 Sturm Graz vs Rennes
A draw emerges as the most likely outcome for this UEFA Europa League clash on Wednesday, with both teams occupying similar league positions—Sturm Graz fourth in Austria and Rennes third in Ligue 1. The prediction carries 33% confidence in a stalemate. Defensive solidity should prevail, with BTTS at 62% confidence for no goals from either side. Rennes' away form will face a stern examination against a well-organized Sturm Graz side on home soil.

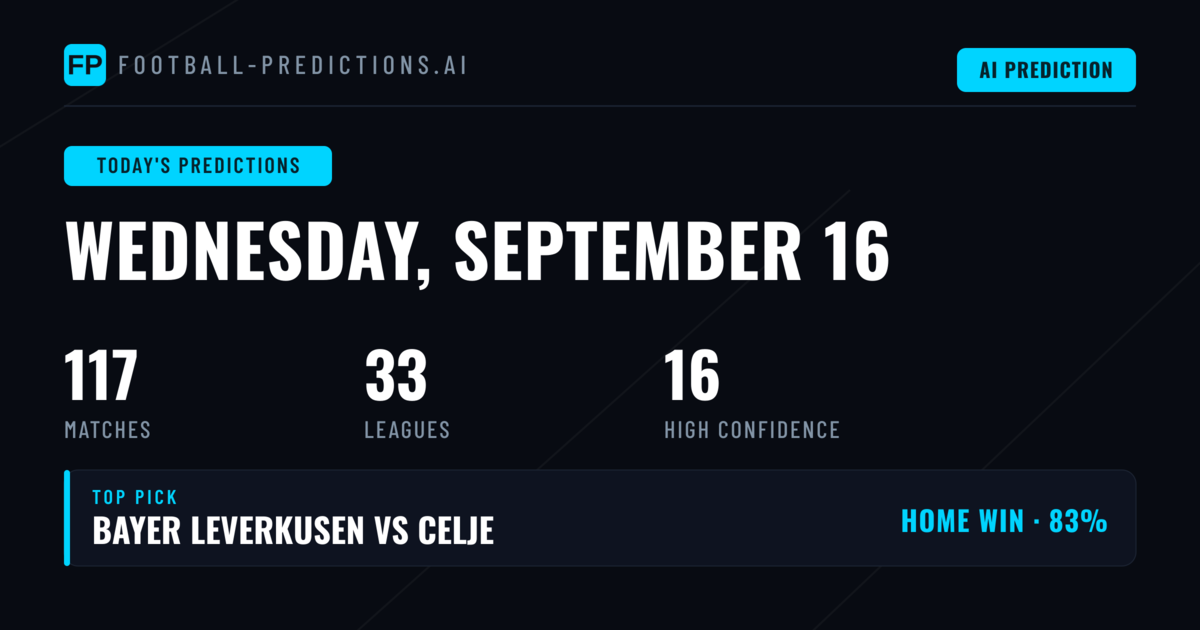
 Bayer Leverkusen vs Celje
The Bundesliga side hosts the Slovenian league leaders in a compelling UEFA Europa League fixture. Celje's top domestic standing makes this an intriguing underdog test against Leverkusen in seventh place. A draw registers at 33% confidence, suggesting a closely contested match in Germany. Both teams to score carries 62% confidence against, indicating expected defensive discipline. Celje's league-best record suggests they possess the quality to frustrate their higher-profile opponents.
Cup Competitions: Where Goals Flow and Giants Fall
 FA Cup
The 2025/26 FA Cup campaign confirmed why England's historic knockout competition remains the benchmark for dramatic cup football. Across 812 matches throughout the season, the tournament produced a remarkable 3.32 goals per game, a figure that consistently rewarded Over bettors while leaving defensive teams scrambling for solutions at every level of the English football pyramid. Home teams secured 1504 victories over the course of the campaign, illustrating the continued importance of home advantage even as lower-league clubs pushed established names to their limits. The combination of high-scoring encounters and unpredictable outcomes made the FA Cup a fertile hunting ground for those tracking attacking trends across domestic cup competitions.
 Coppa Italia
The Coppa Italia 2025/26 season carved its place in the record books as one of the most prolific attacking tournaments in recent memory. Thirty-three matches generated 91 goals at an average of 2.76 per game, a total that dwarfed typical cup norms and suggested a tournament where defensiveOrganisation took a back seat to entertainment. The 2026 edition continues this trajectory, with the attacking verve that defined the previous season showing no signs of diminishing as new contenders enter the fray. Teams progressing through the Coppa Italia this week will need to balance their natural attacking instincts with the tactical discipline required for cup survival, a challenge that has proven difficult for many throughout this exceptionally high-scoring cycle.
 CONMEBOL Libertadores
The CONMEBOL Libertadores 2026/27 campaign reaches its decisive phase with 118 matches already completed and the tournament at 83 percent completion. The group stage standings reveal a familiar pattern of South American giants asserting their authority alongside a handful of determined challengers. Flamengo sits atop the table with 16 points from six matches, having won five of their six encounters while suffering no defeats. Independ. Rivadavia matches Flamengo's tally exactly, also collecting 16 points through five wins and a single draw in their six fixtures. Both clubs carry identical form guides of WWDWW into their upcoming matches, suggesting momentum that could prove decisive as the group stage reaches its climax.
Below the leaders, U. Catolica holds third place with 13 points from four wins, one draw, and one defeat in their six matches. Corinthians occupies fourth position on 11 points, though their three wins, two draws, and single loss indicate a campaign that has lacked the consistency of the frontrunners. Coquimbo Unido rounds out the leading pack with 10 points, their campaign featuring three wins against two losses from six fixtures. The form guide of LWWLW suggests a team capable of building sequences but occasionally vulnerable to the intensity that defines continental competition at this stage. As the group stage enters its decisive phase, the tactical adjustments and squad rotation decisions made over the coming days will determine which of these five clubs advances with momentum rather than merely survival on their side.
In-Form Teams Lighting Up European Football
Several clubs enter the week riding remarkable unbeaten streaks, combining relentless attacking output with defensive solidity that has left opponents struggling for answers across domestic leagues. With 1024 fixtures scheduled between September 14-20, 2026, these sides represent the form teams worth tracking for any football enthusiast or analyst.
Celtic have set the benchmark in Scotland, sitting top of the Scottish Premiership with 18 points from 6 matches. Their record reads six wins from six attempts, conceding just three goals while finding the net 14 times. The attacking verve has been spearheaded by K. Høgh, who has plundered three goals in only two appearances. Celtic's domestic dominance now faces a different test as they prepare for UEFA Europa League action this week, with their first continental assignment presenting fresh tactical challenges.
 FC Porto mirror Celtic's perfection in Portugal, also collecting 18 points from six games with an identical six-win sequence. The Dragons have been particularly miserly at the back, shipping just two goals while rattling in 15 at the other end. Gabri Veiga has contributed one goal and one assist across two substitute appearances, suggesting creative threat from the bench. Porto's all-round Primeira Liga display positions them as heavy favourites whenever they next take domestic field.
 PSV Eindhoven lead the Eredivisie with 16 points from six matches, their record of five wins and one draw reflecting continued domestic authority. The Dutch outfit boast the most prolific attack among these form teams, plundering 22 goals already, though their defensive record of seven conceded shows occasional vulnerability. S. Dest has registered once in a single appearance, indicating goals are distributed across the squad. PSV take their momentum into another fixture this week, seeking to extend their advantage at the summit.
 Barcelona have made an explosive start to their La Liga campaign, collecting 15 points from five matches courtesy of five consecutive victories. Their goal difference reads an eye-watering plus-17, with 21 scored and four conceded, making them the most clinical outfit in Europe's top leagues relative to games played. Raphinha leads their charge with two goals and one assist from a single appearance, demonstrating immediate impact. Barcelona's relentless early-season form marks them as the team others must chase in Spain.
Benfica sit second in the Primeira Liga on 16 points, one behind rivals Porto, with their record showing five wins and one draw from six attempts. The Eagles have been equally devastating in attack, hitting 21 goals while conceding just four. V. Pavlidis has been clinical in front of goal, netting five times alongside one assist in just three appearances. Benfica now turn their attention to UEFA Europa League competition this week, where their domestic sharpness will face continental examination.
 Anderlecht begin their European journey this week in the Europa League, entering the group stage fresh from domestic success. The Belgian side had built a five-win sequence domestically before their focus shifted to continental matters. A. Bertaccini had found the net once across two appearances in prior competition, and the squad will aim to transfer domestic confidence onto the European stage when they face Celtic in their opening group fixture.
Reviewing Last Week's Predictions: A Mixed Week Across the Board
The week of Sep 7 to Sep 13 delivered a challenging test for our predictive model, with overall results reflecting the inherent unpredictability of competitive football. The 1x2 market proved particularly difficult, with our model landing 277 correct predictions out of 661 matches, translating to an accuracy of 41.9%. This represented a dip below our typical performance threshold, a reminder that even the most refined statistical models encounter stretches where results diverge from expectations.
More encouraging signals emerged in the goal markets. The Over/Under category performed solidly at 57.8% accuracy, with 338 correct calls from 585 predictions, while BTTS predictions hit the mark 54.6% of the time across 661 fixtures. The average goals per match stood at 2.92, and both teams found the net in 55.6% of fixtures, indicating a week characterised by attacking intent rather than defensive solidity across many competitions.
Placed against our longer-term track record compiled over approximately 90 days and 6,514 predictions, last week's 1x2 figure of 41.9% sits below the 48.8% baseline we have established over that sample. However, the Over/Under result at 57.8% came within touching distance of our 90-day figure of 58.2%, while the headline pick accuracy of 58.9% over the longer window provides a reliable anchor point for confidence. The Double Chance market has historically been our strongest performer at 75.9% across the 90-day window, a testament to the value of covering multiple outcomes in uncertain fixtures.
As we turn our attention to the 1,024 matches scheduled for this week, our model continues to process fresh data and recalibrate its outputs. The statistical foundations remain robust, and short-term variance is factored into our methodology. On our statistics page you can study our performance in detail across every bet type and in the context of all tournaments.
Half Time / Full Time Predictions Today — AI Tips & Strategies
Table of Contents
- What Is Half Time / Full Time Betting?
- All 9 HT/FT Outcomes Explained
- HT/FT Statistics and Probabilities
- How Our AI Predicts HT/FT
- HT/FT Betting Strategies
- Finding Value in the HT/FT Market
- Best Leagues for HT/FT Betting
- HT/FT in Accumulators
- Common Mistakes in HT/FT Betting
What Is Half Time / Full Time Betting?
Half Time / Full Time (HT/FT) is a market where you predict both the half time result AND the full time result in a single bet. With three possible outcomes at each interval (Home lead, Draw, Away lead), there are 9 possible combinations — making this one of the most complex and highest-odds standard markets available.
The appeal of HT/FT lies in its odds. While a simple Home Win might pay 1.50, predicting Home/Home (leading at half time and winning at full time) might pay 2.20. More unusual outcomes like Draw/Away (level at HT, away win at FT) can pay 8.00-15.00. This makes HT/FT a favorite for bettors seeking bigger returns from single selections without resorting to exotic markets.
The market requires you to understand how matches unfold over 90 minutes — not just who wins, but when the winning team establishes control. A team that dominates from minute 1 is a Home/Home candidate. A team that starts slowly but finishes strong is a Draw/Home candidate. This temporal dimension adds analytical depth that pure result betting lacks.
HT/FT is also one of the few standard markets where you can find genuinely high odds (15.00-35.00) on outcomes that, while rare, are not random. Comeback scenarios follow identifiable patterns — certain teams, managers, and match contexts produce comebacks at significantly higher rates than average. Our AI exploits these patterns to identify value across all 9 outcomes.
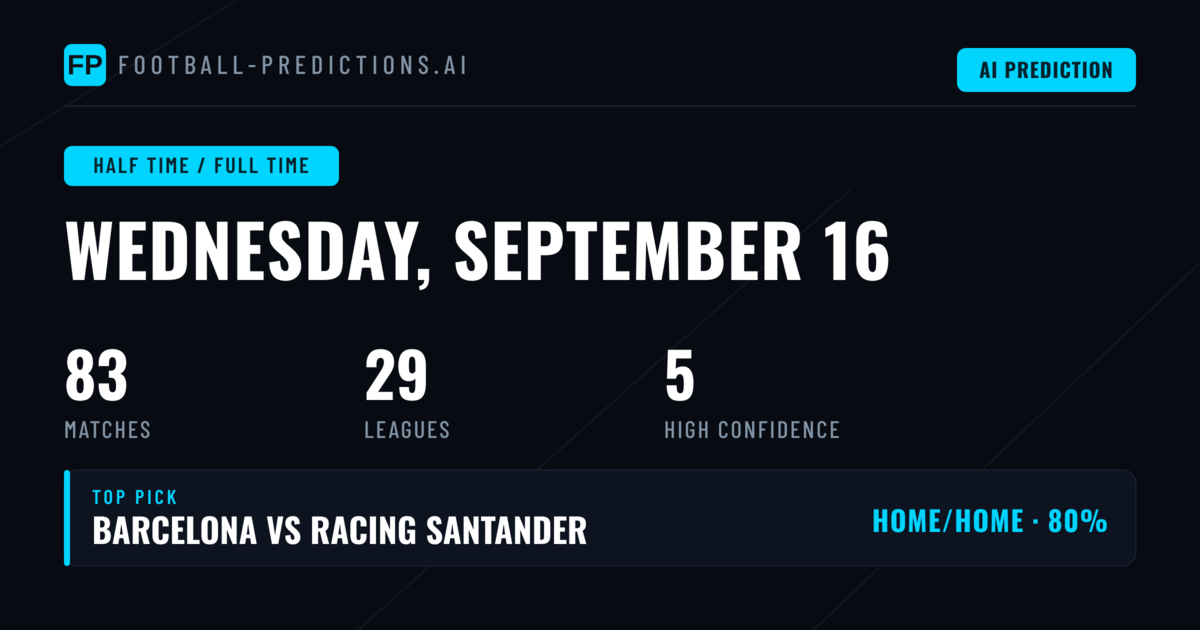
Today, our AI has analyzed 83 matches across 29 leagues. The most common HT/FT prediction is 2/2, appearing in 33% of picks. Our highest-confidence pick is Trygg/Lade vs Molde — 2/2 at 80% confidence with odds of 1.25.
All 9 HT/FT Outcomes Explained
Understanding each of the 9 outcomes is essential for effective HT/FT betting. Each outcome tells a different story about how the match unfolded:
| HT/FT | Meaning | Typical Odds | Frequency |
|---|---|---|---|
| 1/1 | Home leads HT, Home wins FT | 2.10 – 3.00 | ~25% |
| X/1 | Draw at HT, Home wins FT | 3.50 – 5.50 | ~15% |
| 2/1 | Away leads HT, Home wins FT (comeback) | 15.00 – 30.00 | ~2% |
| 1/X | Home leads HT, Draw at FT | 8.00 – 15.00 | ~4% |
| X/X | Draw at HT, Draw at FT | 4.00 – 6.00 | ~14% |
| 2/X | Away leads HT, Draw at FT | 10.00 – 20.00 | ~3% |
| 1/2 | Home leads HT, Away wins FT (comeback) | 18.00 – 35.00 | ~1.5% |
| X/2 | Draw at HT, Away wins FT | 5.00 – 8.00 | ~12% |
| 2/2 | Away leads HT, Away wins FT | 4.50 – 7.00 | ~10% |
The three "consistent" outcomes (1/1, X/X, 2/2) account for roughly 49% of all matches — teams that lead at half time usually go on to win. The three "comeback" outcomes (2/1, 1/2, 2/X) account for under 7% combined — true comebacks are rare in professional football. The remaining "shift" outcomes (X/1, X/2, 1/X) account for about 31% and represent the most interesting betting opportunities.
The Consistent Outcomes (1/1, X/X, 2/2)
These are the "safe" HT/FT selections. A team leading at half time goes on to win approximately 75-80% of the time, making 1/1 and 2/2 the most predictable outcomes. X/X is slightly different — it requires the match to remain level throughout, which demands a specific type of encounter (defensive, low-quality, or evenly matched teams). The consistent outcomes offer the lowest HT/FT odds but the highest hit rates.
The Shift Outcomes (X/1, X/2, 1/X)
These outcomes represent the match shifting in the second half. X/1 and X/2 — where a draw at half time becomes a win for one team — are surprisingly common, accounting for 27% of matches combined. These shifts typically happen when one team adjusts tactically at half time or when the trailing team commits more players forward, creating space for the eventual winner. 1/X is rarer and represents a team that loses its grip on the match.
The Comeback Outcomes (2/1, 1/2, 2/X)
The most dramatic and highest-odds outcomes. Full comebacks (2/1, 1/2) require a team to be losing at half time and then turn the match around completely. These occur in just 3.5% of matches combined but offer odds of 15.00-35.00. 2/X represents the away team losing its lead — slightly more common at ~3% because the pressure of leading away from home can be psychologically draining.
HT/FT Statistics and Probabilities
Understanding which HT/FT outcomes are common helps calibrate your expectations and identify value:
Most Common Outcomes
- 1/1 (~25%): The home team establishes control early and maintains it. Most common in matches with strong favorites. Average odds: 2.40. The implied probability at those odds is ~42%, yet it occurs in only 25% of matches — however, the odds reflect the higher frequency of this outcome among matches where the home team is favored.
- X/1 (~15%): Close first half, home team breaks through in the second. Occurs frequently when the home team is patient and the away team tires. Average odds: 4.20. This is where systematic value is most often found.
- X/X (~14%): Goalless or level throughout. Common in defensive matchups, derbies, and dead-rubber matches. Average odds: 4.80. Most of these are 0-0 draws, making it closely linked to defensive patterns.
- X/2 (~12%): The away team finds a breakthrough in the second half. Common when technically superior away teams need time to break down the home defense. Average odds: 6.50.
- 2/2 (~10%): Away dominance throughout. Occurs when the away team is significantly stronger. Average odds: 5.80. Most common when top-4 teams visit bottom-half opponents.
Rarest Outcomes
- 1/2 (~1.5%): Home leads at HT, away wins — the rarest comeback. Odds of 20.00+ but extremely difficult to predict. Occurs most in cup matches where the underdog takes an early lead before the favorite responds.
- 2/1 (~2%): Away leads at HT, home wins — a dramatic turnaround. Odds of 15.00-25.00. Teams with exceptionally strong benches (substitution impact) produce this outcome more frequently.
- 2/X (~3%): Away leads at HT, match drawn — the away team squanders its lead. Odds of 12.00-18.00. Common when a counter-attacking team scores first but can't sustain defensive intensity for 90 minutes.
View detailed HT/FT statistics across 29+ leagues →
How Our AI Predicts HT/FT
HT/FT prediction is one of the most complex markets because it requires modeling the temporal flow of a match. Our AI approaches this through a multi-layered probability engine:
First-Half Probability Engine
The model first calculates HT 1/X/2 probabilities using first-half-specific data. This includes early scoring patterns, tactical aggression levels, first-half xG, and historical first-half results for both teams. A team that scores in the first 30 minutes in 60% of home matches has a dramatically different HT probability profile than one that typically scores after the break.
Conditional Second-Half Modeling
Given a specific HT state, the model calculates the probability of each FT outcome. This conditional approach is critical because teams behave very differently depending on the half-time score. A team trailing at HT has different tactical behavior than one leading — more attacking substitutions, higher defensive lines, and increased risk-taking. The model captures these conditional dynamics through team-specific game-state analysis.
Team Scoring Curves
Some teams score evenly across 90 minutes; others are dramatically weighted toward one half. A team that scores 70% of its goals in the second half is a strong X/1 or X/2 candidate but a poor 1/1 candidate. Our model maintains minute-by-minute scoring distributions for every team, identifying temporal patterns that simple averages miss.
Manager and Tactical Profiles
Certain managers consistently produce specific HT/FT patterns. Defensive-minded managers who set up cautiously in away matches generate more X/2 results. Aggressive managers who press from the start produce more 1/1 and 2/2 results. The model incorporates managerial tendencies as a factor in its temporal predictions.
Second-Half Comeback Patterns
Historical data on how often each team recovers from deficit positions is tracked separately. Some teams are notorious for comebacks (strong bench, tactical flexibility, mental resilience); others rarely recover from falling behind. This data directly feeds into the probability of rare outcomes like 2/1 and 1/2.
Today's HT/FT predictions span odds from 1.25 to 5.90, with an average of 3.42. The model identifies value by comparing its probability estimates against bookmaker odds for each of the 9 outcomes.
HT/FT Betting Strategies
1. The X/1 Specialist
Focus on Draw/Home (X/1) — the most under-priced HT/FT outcome. Target matches where the home team has a strong second-half record, the away team is defensively organized in the first half, and the home team's manager is known for effective half-time adjustments. At typical odds of 3.80-5.00, a 22-25% hit rate produces significant profit.
The X/1 strategy works best in leagues where home teams are patient and methodical. La Liga, where teams like Barcelona and Real Madrid often break deadlocks in the second half, and Serie A, where defensive first halves are common, are ideal hunting grounds. Track each team's percentage of home wins that started as HT draws — teams above 40% in this metric are systematic X/1 generators.
2. The 1/1 Accumulator Builder
Use Home/Home (1/1) as accumulator legs when strong favorites play at home. At odds of 2.20-2.80, two 1/1 legs combine for 4.84-7.84 odds. Target teams that score early goals (within 25 minutes) at a high rate — these teams establish HT leads that they maintain to full time. This is the safest HT/FT accumulator strategy.
Look for matches where the home team has scored in the first half in 65%+ of home games AND the away team concedes first-half goals in 50%+ of away games. This convergence of attacking and defensive patterns significantly boosts 1/1 probability above the 25% base rate.
3. The X/X Draw Double
Select two matches likely to end in goalless draws or stalemates and combine X/X as a double. At average odds of 4.80 each, the combined return is 23.04x your stake. Focus on matches between defensive mid-table teams in Serie A or Ligue 1, where HT and FT draw rates are both above average. Teams with minimal attacking threat but solid defensive structure are ideal X/X candidates.
4. Comeback Hunting (High Risk, High Reward)
The 2/1 and 1/2 outcomes are rare (~3.5% combined) but offer enormous odds (15.00-35.00). Only bet these when specific conditions align: a strong team known for comebacks, an opponent known for collapsing in the second half, and clear motivation for the trailing team to push forward. Small stakes only — think of these as lottery tickets backed by data.
Certain teams are statistically proven comeback specialists. In the Premier League, teams with deep benches featuring impact substitutes (quick forwards, creative midfielders) produce comebacks at 2-3x the average rate. Track each team's points won from losing positions — this is the single best predictor of comeback HT/FT outcomes.
5. The Second-Half Specialist Strategy
This strategy focuses exclusively on outcomes where the second half differs from the first: X/1, X/2, 1/X, and 2/X. Combined, these represent about 34% of all matches. By studying second-half tactical tendencies, substitution patterns, and fitness levels, you can build a portfolio of "second-half shift" bets that capture value from the temporal dynamics of football matches.
Effective Approaches
- Target X/1 as your primary value play — most underpriced outcome
- Use 1/1 doubles for lower-risk accumulator building
- Track team scoring curves (first-half vs second-half goal distribution)
- Study manager half-time tactical adjustment patterns
- Use comeback bets only with small stakes and specific triggers
- Focus on leagues with predictable temporal patterns (Serie A, La Liga)
Common Pitfalls
- Don't only bet 1/1 — it's the most efficiently priced outcome
- Avoid ignoring temporal scoring data (first-half vs second-half splits)
- Never use the same stake for 2.50 odds (1/1) and 25.00 odds (2/1)
- Don't bet comeback markets without specific evidence of comeback tendency
- Avoid HT/FT in matches with heavy rotation or unpredictable lineups
- Don't forget that HT/FT margins are wider than 1X2 — you need bigger edge
Finding Value in the HT/FT Market
The HT/FT market has wider bookmaker margins than 1X2 (typically 12-18% overround across 9 outcomes), but it also has larger mispricings. Here's where value most often hides:
X/1 in "Slow Starter" Home Teams
Teams that typically score in the second half are systematically underpriced for X/1 because the market overweights the favorite's overall strength rather than their temporal scoring pattern. A team that wins 60% of home matches but only leads at HT in 35% of them has a significantly higher X/1 probability than the odds suggest. Our AI identifies these discrepancies by comparing team-specific HT probabilities against offered odds.
X/X in Defensive Leagues
The draw-draw outcome is often overpriced (too high odds) in defensive leagues where 0-0 and 1-1 full-time results are common. A team with a 42% HT Draw rate and a 28% FT Draw rate has roughly a 17% X/X probability — often worth more than the odds suggest. Serie A derbies and Ligue 1 mid-table clashes are prime X/X hunting grounds.
2/2 in Away-Dominated Mismatches
When a clearly stronger away team visits a weak home side, 2/2 odds are often too generous because the market still factors in generic home advantage that doesn't apply to the specific matchup. Top-4 teams visiting bottom-3 teams in any league offer systematic 2/2 value, especially when the away team has a strong first-half scoring record.
Shift Outcomes After Manager Changes
When a team appoints a new manager, the first few matches often show distinct temporal patterns — typically more cautious first halves as players adapt to new instructions, followed by more confident second halves. This creates temporary value on X/1 and X/2 outcomes that the market doesn't price in quickly.
Best Leagues for HT/FT Betting
Different leagues produce vastly different HT/FT patterns, and understanding these differences is crucial for profitable betting:
| League | Best HT/FT Outcomes | Key Pattern |
|---|---|---|
| Serie A | X/X, X/1 | Defensive first halves, tactical second-half shifts |
| La Liga | X/1, 1/1 | Patient home teams breaking deadlocks late |
| Premier League | 1/1, X/1 | Fast starts from favorites, comeback potential |
| Bundesliga | 1/1, 2/2 | Open attacking play from minute 1 |
| Ligue 1 | X/X, X/2 | Defensive stalemates, PSG away domination |
| Eredivisie | 1/1, 2/1 | High-scoring, volatile with more comebacks |
| Championship | X/1, 1/1 | Physical first halves, fitness-based second halves |
Serie A is the standout league for HT/FT betting because its defensive tradition creates highly predictable first-half patterns. The Italian tendency toward cautious first halves followed by more open second halves makes X/1 and X/X systematically reliable. The Bundesliga, conversely, is more challenging for HT/FT betting because its open, end-to-end style makes temporal patterns less predictable.
HT/FT in Accumulators
HT/FT selections can be powerful accumulator components because even "safe" outcomes like 1/1 offer higher odds than simple 1X2 bets:
| Strategy | Legs | Avg Odds | Combined | Est. Hit Rate |
|---|---|---|---|---|
| 1/1 Double | 2 | 2.50 | 6.25 | ~6% |
| 1/1 + X/1 Double | 2 | 3.50 | 12.25 | ~4% |
| X/X Double | 2 | 4.80 | 23.04 | ~2% |
| Mixed HT/FT Treble | 3 | 3.00 | 27.00 | ~1% |
The 1/1 double is the most practical HT/FT accumulator — two strong home favorites expected to dominate from the start. At combined odds of 6.00+, this offers significantly better returns than a simple 1X2 double while maintaining a realistic hit rate. Target matches where both home teams score first-half goals in 60%+ of home games.
For higher returns, combine one 1/1 selection (safer leg) with one X/1 selection (value leg). This creates a double with 8.00-12.00 combined odds that captures both reliability and value. The 1/1 leg provides a foundation while the X/1 leg boosts returns.
Pure HT/FT trebles are very high-variance and should only be played with small stakes. Even three 1/1 selections at 2.50 each produce combined odds of 15.63 with a hit rate around 1.5-2%. Treat these as bonus bets rather than core accumulator strategy.
Build an accumulator with AI-rated HT/FT picks →
Common Mistakes in HT/FT Betting
Avoiding these common errors will immediately improve your HT/FT results:
- Only betting 1/1: Home/Home is the most obvious HT/FT bet but also the most efficiently priced. The real value often lies in less popular outcomes like X/1, X/X, and X/2, where bookmaker pricing is less sharp. Diversify across outcomes to find edge.
- Ignoring temporal scoring data: Using full-match statistics for HT/FT predictions is a fundamental error. A team that scores 70% of goals in the second half has completely different HT/FT probabilities than one that scores evenly. Always use half-specific data — our AI does this automatically.
- Betting comeback markets casually: 2/1 and 1/2 look attractive at 15.00+ odds but occur in only 1.5-2% of matches. These should only be bet with very small stakes when specific conditions are met — not as regular selections. Even 1 in 50 bets is a realistic hit rate for these outcomes.
- Staking HT/FT the same as 1X2: HT/FT has inherently lower probabilities per outcome. Your staking should reflect this — use 0.5-1.5% of bankroll rather than 1-3%. Treat HT/FT as a value-hunting market, not a volume-staking market.
- Not considering HT/FT for draws: X/X is one of the most under-bet HT/FT outcomes. Many bettors who confidently predict a full-time draw forget they can enhance the return by predicting the HT result too. If you're backing a draw, consider whether X/X is more likely than 1/X or 2/X — it usually is.
- Ignoring match tempo indicators: Pre-match data on average possession, pressing intensity, and early booking rates can predict first-half patterns. Teams with high pressing intensity produce more eventful first halves, while possession-heavy teams often produce cautious, low-scoring opening periods.
Browse today's HT FT prediction — a high-odds market combining the half time and full time results. Half time full time prediction covers 9 possible outcomes (1/1, 1/X, 1/2, X/1, X/X, X/2, 2/1, 2/X, 2/2) for bigger returns than standard 1X2. Our AI examines match-flow patterns, comeback statistics and first-half dominance to identify the most likely HT/FT predictions for today. The most popular HT FT tips include 1/2 and 2/1 comeback selections with odds typically above 10.00.
HT/FT Predictions FAQ
What is HT/FT betting?
HT/FT predicts both the half time and full time result. There are 9 possible outcomes (1/1, 1/X, 1/2, X/1, X/X, X/2, 2/1, 2/X, 2/2). Today our AI has 83 HT/FT predictions across 29 leagues with odds from 1.25 to 5.90.
What is the most common HT/FT result?
1/1 (Home leading at HT, Home winning at FT) is the most common at ~25%. X/1 (Draw at HT, Home win at FT) is next at ~15%. Today the most predicted HT/FT is 2/2 (33% of picks).
What does X/1 mean in HT/FT?
X/1 means Draw at half time, Home Win at full time. The home team breaks a deadlock in the second half. This occurs in ~15% of matches and typically offers odds of 3.50-5.50, making it one of the best value HT/FT selections.
Are HT/FT bets profitable?
Yes — the higher odds compensate for lower hit rates. X/1 at 4.00 needs only a 25% hit rate to profit. Our AI identifies the best value across all 9 outcomes. Top pick today: Trygg/Lade vs Molde — 2/2 at 80% confidence.
Can I use HT/FT in accumulators?
Yes, but be cautious with accumulator size. HT/FT legs have lower individual probabilities. A double combining two 1/1 picks at 2.50 each gives 6.25 odds with ~6% probability. Keep HT/FT accumulators to 2-3 legs maximum.
What is the rarest HT/FT outcome?
1/2 (Home leading at HT, Away winning at FT) is the rarest at ~1.5%, with odds of 18.00-35.00. It requires the away team to overcome a deficit — a dramatic comeback scenario that occurs in fewer than 2 in 100 matches.